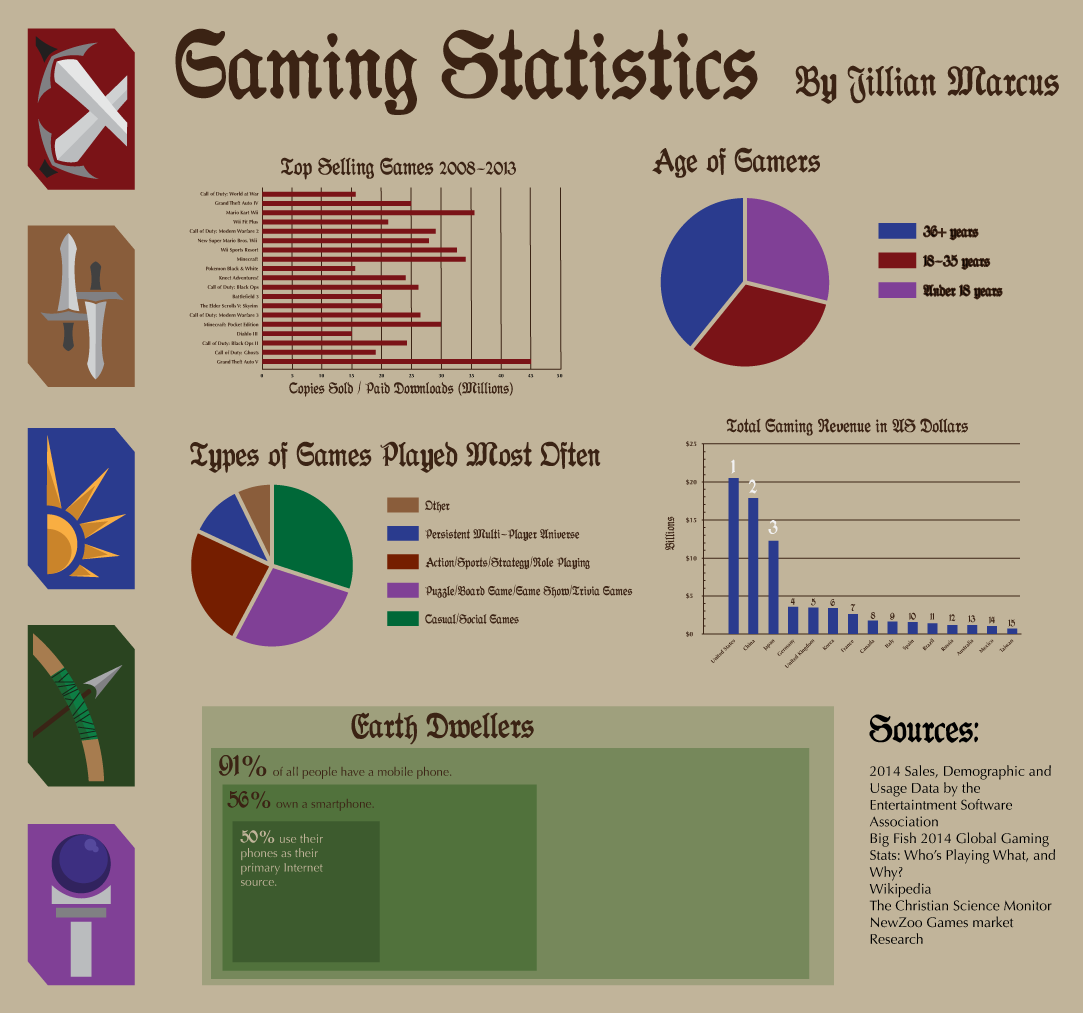
Because of my Information Science and Technology minor, I was able to access a class which taught how to make infographics and data visualization pieces (a skill that every Graphic Designer should have in their toolkit).
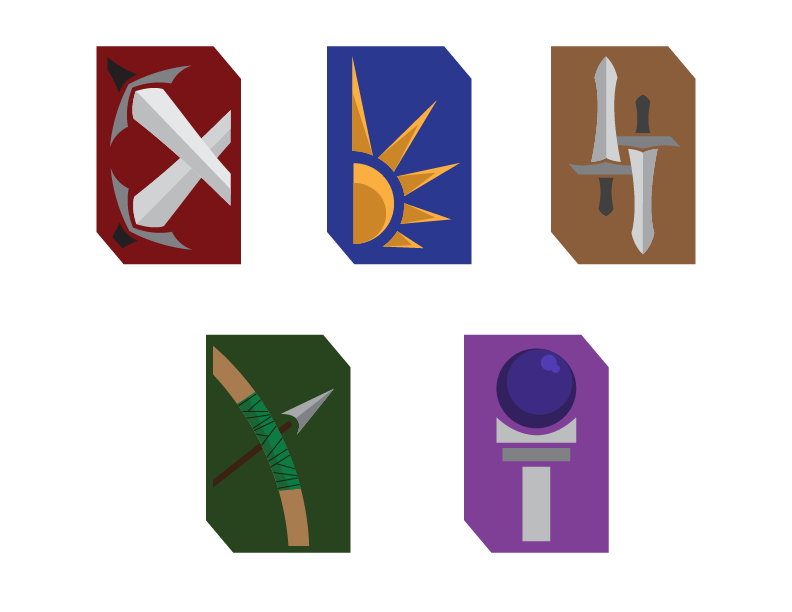
For this piece in particular, the task was to create icons and to visualize statistics given to us. I decided to make icons for Dungeons and Dragons classes (Fighter, Rogue, Cleric, Druid, and Mage respectively). Though it wasn’t a required parameter of the assignment, I formatted the rest of the infographic around a medieval theme because of the icons I chose to create.
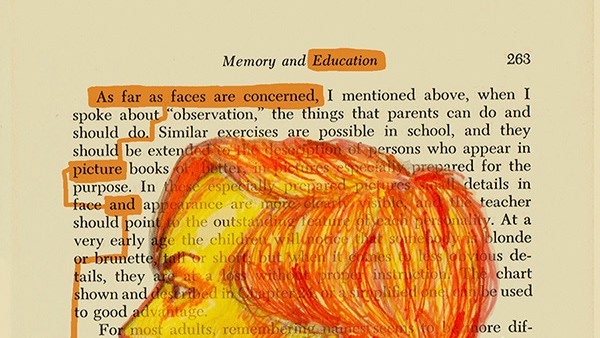
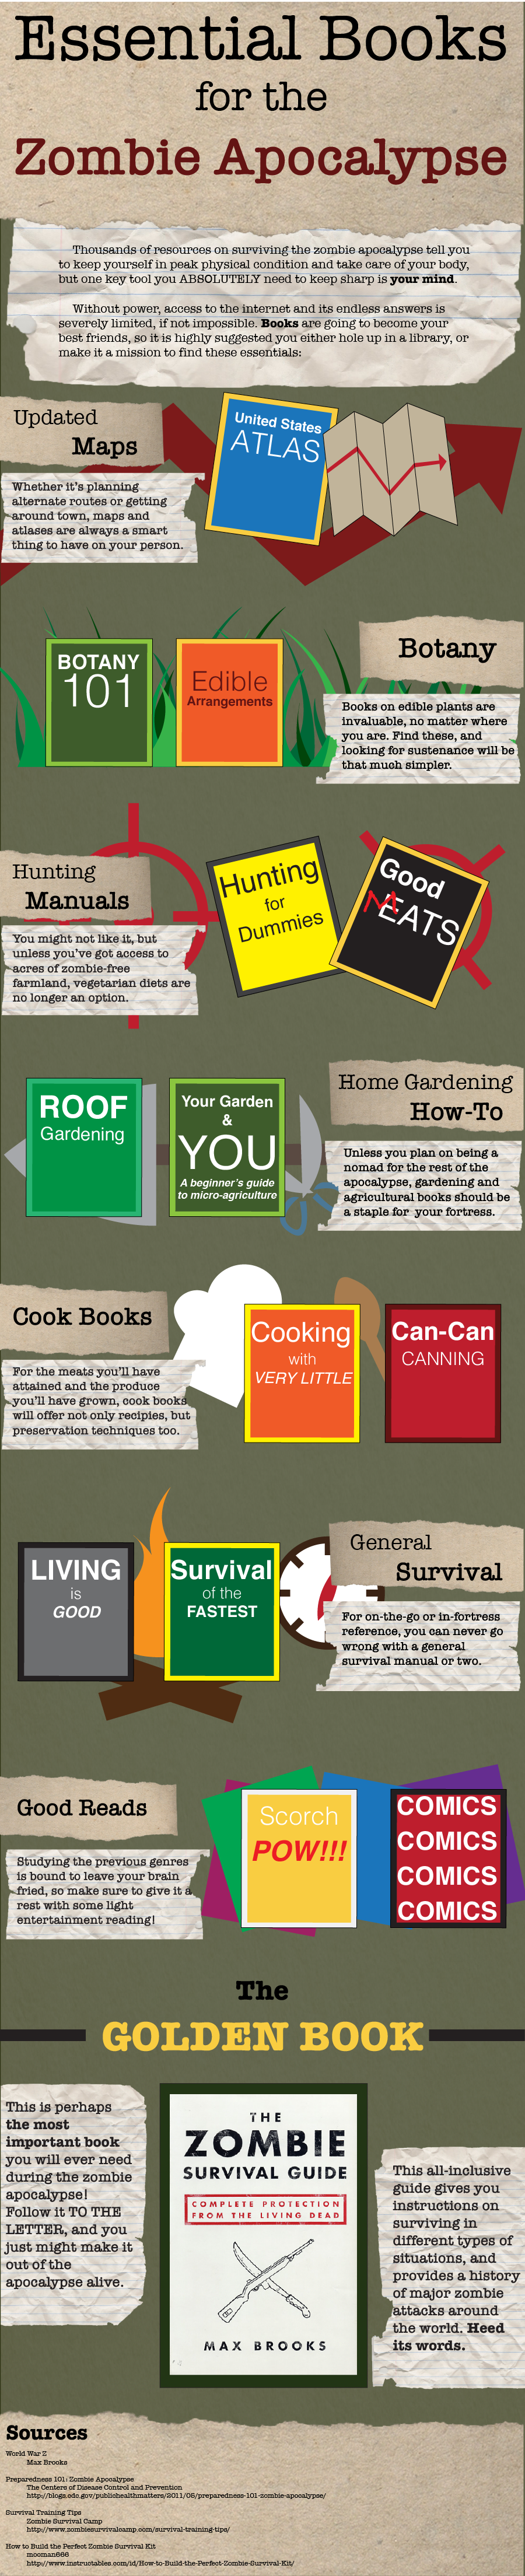
For the same data visualization class mentioned before, I created an opinion-based infographic on the best books to have during the zombie apocalypse. While it wasn’t required to create our own graphics, I found it easier to make my own as opposed to searching for the right one (the only exception being the cover for Max Brooks’ The Zombie Survival Guide ).
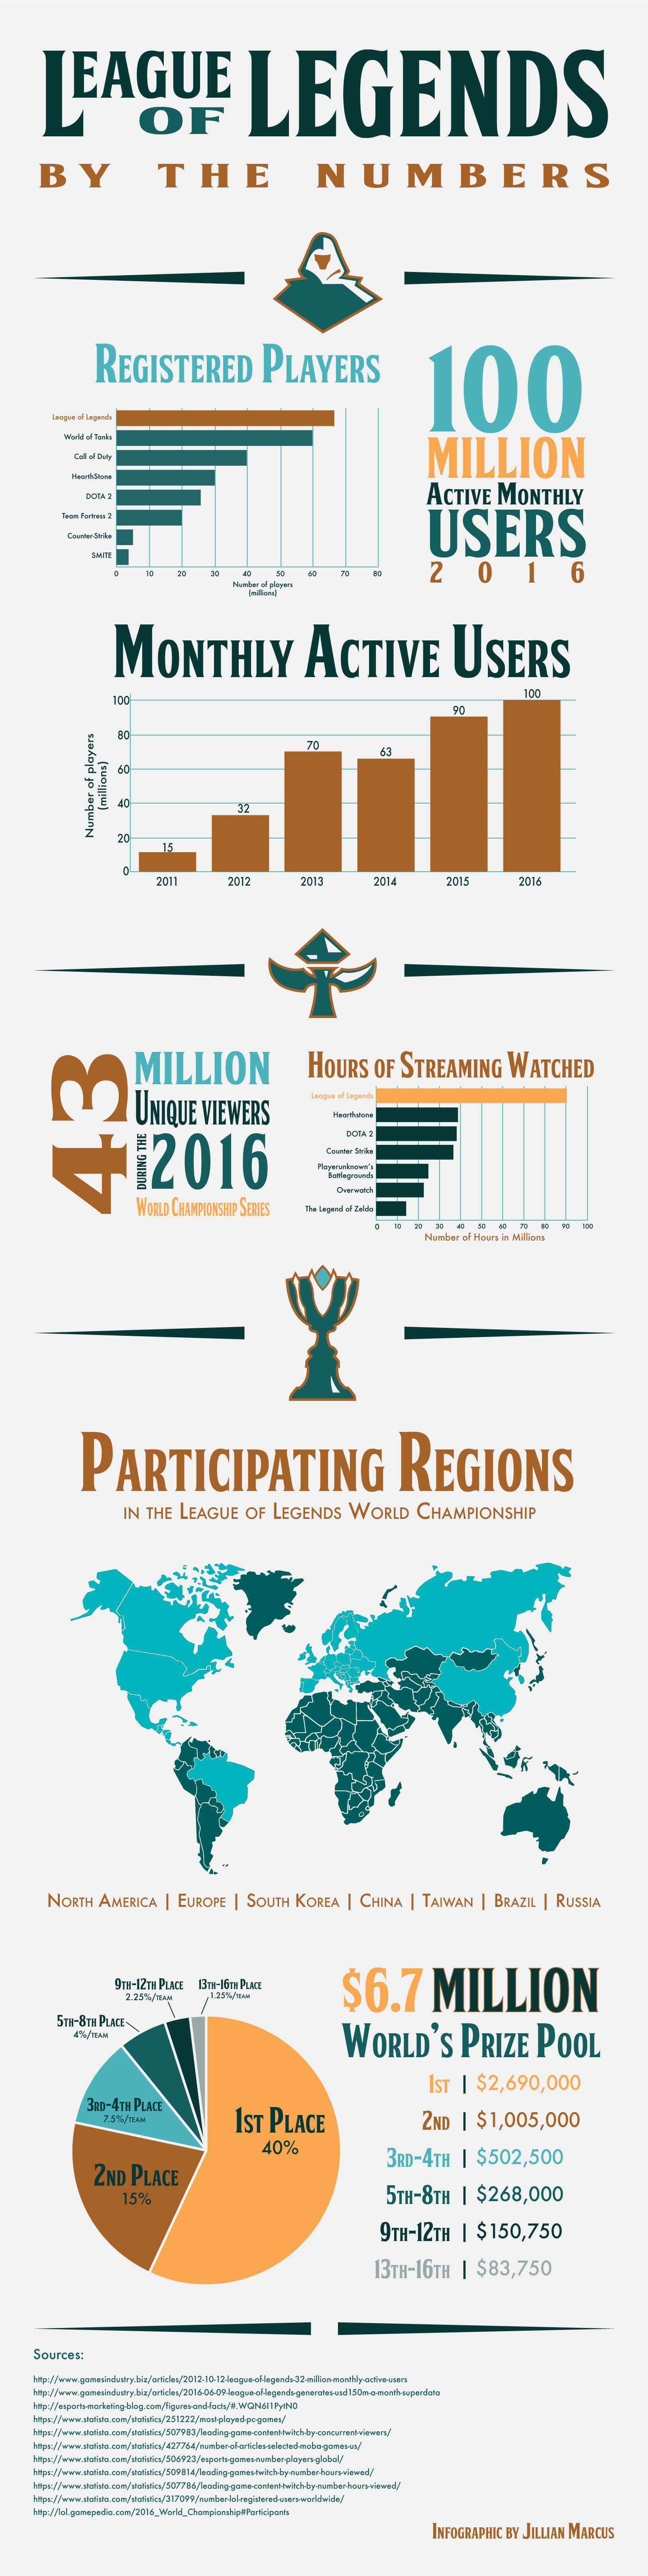
For the final project in the Information Graphics class, we had to choose a topic, research its statistics, and visualize the data we found. For my topic, I chose the Multiplayer Online Battle Arena (MOBA) game League of Legends. The icons were hand-made also, the only outside source I used being a blank map that I colored in.